
A control room running five or six different monitoring tools always ends up with the same symptom: alert storms. A UPS switches to battery, a network link saturates, three PLCs trip into fault, and the console fires off dozens of notifications within seconds, maybe ten of which actually matter. The operator doesn’t have five screens’ worth of time to sort through them. Hypervision exists to solve exactly this problem of noise and fragmentation.
Hypervision means collecting, normalizing, correlating, and displaying events from several independent monitoring systems in a single interface. In English-language IT operations, this concept is often called a manager-of-managers (MoM). The platform that does this work doesn’t monitor equipment directly. It plugs into existing monitoring layers (network, application, SCADA, BMS, video surveillance) and processes their data streams the same way, no matter where they come from.
The mechanics break down into four stages. Collection pulls together mismatched protocols: SNMP, Syslog, traps, REST APIs, OPC UA, MQTT. Normalization converts all of that into one shared event model (severity, equipment, timestamp, location). Correlation strips out duplicates, groups alerts that share a root cause, and uses topology to trace back to that cause. Display, finally, projects a prioritized view onto operator workstations and the video wall.
People often mix this up with monitoring, but the line between the two is clear. Monitoring asks “is this piece of equipment within its thresholds?” over a defined scope. Hypervision asks “what’s the real state of things across every layer, and where does attention need to go first?” Three traits define it: a wide scope spanning multiple sites and domains, heterogeneous sources, and a decision-making purpose rather than a purely technical one.
The real value sits in the correlation engine, and three approaches exist side by side. Rule-based correlation runs on pre-written scenarios (“if A and B happen in the same window, it’s incident C”). It’s precise, but rigid, and it ages badly the moment infrastructure changes. Topological correlation leans on the dependency map, tracking which service runs on which server, behind which switch, powered by which UPS, so it can automatically tie child alerts back to a parent alert. Learning-based correlation picks up on patterns nobody wrote down in the first place. The strongest platforms blend all three, with topology usually delivering the best return for the effort it takes to set up.
IT hypervision takes on the tool sprawl typical of large IT departments: a network monitoring tool here, an APM for applications there, an infrastructure tool, plus whatever legacy systems came along with past mergers. Each one has its own thresholds and dashboards, and none of them sees the information system as a whole. A hypervision layer pulls them together without replacing any of them, so nothing already invested in goes to waste.
The payoff shows up in two concrete numbers. MTTD (mean time to detect) drops because topological correlation isolates the signal that actually matters. An application slowdown gets linked at a glance to the overloaded switch causing it, instead of requiring a hunt across five consoles. MTTR (mean time to resolve) follows close behind, especially once the platform starts triggering automated actions: service restarts, failovers, tickets that open already loaded with context. In a NOC, that’s the gap between an incident wrapped up in minutes and one that turns into a drawn-out hunt.
Under the hood, the hypervision layer sits on top of everything else: collectors query each source (push or pull), an event bus carries the messages through, a normalization and correlation engine processes them, and a presentation layer puts the results on screen. One thing that gets overlooked far too often: once this layer becomes the single point of truth for operations, it needs its own redundancy. If it goes down, the entire room goes blind. High availability, configuration backups, and monitoring of the platform itself all need a place in the project spec, not an afterthought.
It’s worth separating this from observability, too. Observability explains an application’s internal behavior through its metrics, logs, and traces. Hypervision sits a layer above that: it takes the verdicts handed down by observability and monitoring tools and uses them to decide what matters most across domains. The two work together rather than compete.
AI is speeding all of this up through AIOps (Artificial Intelligence for IT Operations): anomaly detection on time series, less noise, root-cause suggestions served up automatically. The market backs this up. According to Grand View Research, AIOps platforms were valued at 14.6 billion dollars in 2024 and are expected to reach 36.07 billion by 2030, growing at an average annual rate of 15.2%.
On the factory floor, industrial process hypervision deals with a rougher mix: programmable logic controllers, SCADA systems, IIoT sensors, drives, safety equipment. These layers map onto the Purdue model (the ISA-95 standard), running from the field level (level 0) up through management systems (level 4). The hypervision layer pulls this data in via OPC UA, Modbus, or MQTT and folds it into one shared picture covering supply, line throughput, utilities, inventory, and shipments, giving the operator a process-level view instead of a machine-by-machine one.
The biggest win here is IT/OT convergence, two worlds kept apart for years over security concerns and just plain different work cultures. Bringing them together makes it possible to trace a line slowdown back to the network fault feeding it, or connect a quality drift to a power dip nobody flagged. Watched continuously (vibration, temperature, power draw), this same data feeds predictive maintenance, letting teams act on early warning signs instead of waiting for something to actually break.
The numbers make the case on their own. Siemens’ “The True Cost of Downtime 2024” study found that the world’s 500 largest companies lose close to 1.4 trillion dollars a year to unplanned downtime, roughly 11% of their combined revenue, a figure up 62% from the 864 billion estimated just four years earlier. At that scale, a hypervision system that cuts down how often incidents happen and how long they last pays for itself fast.
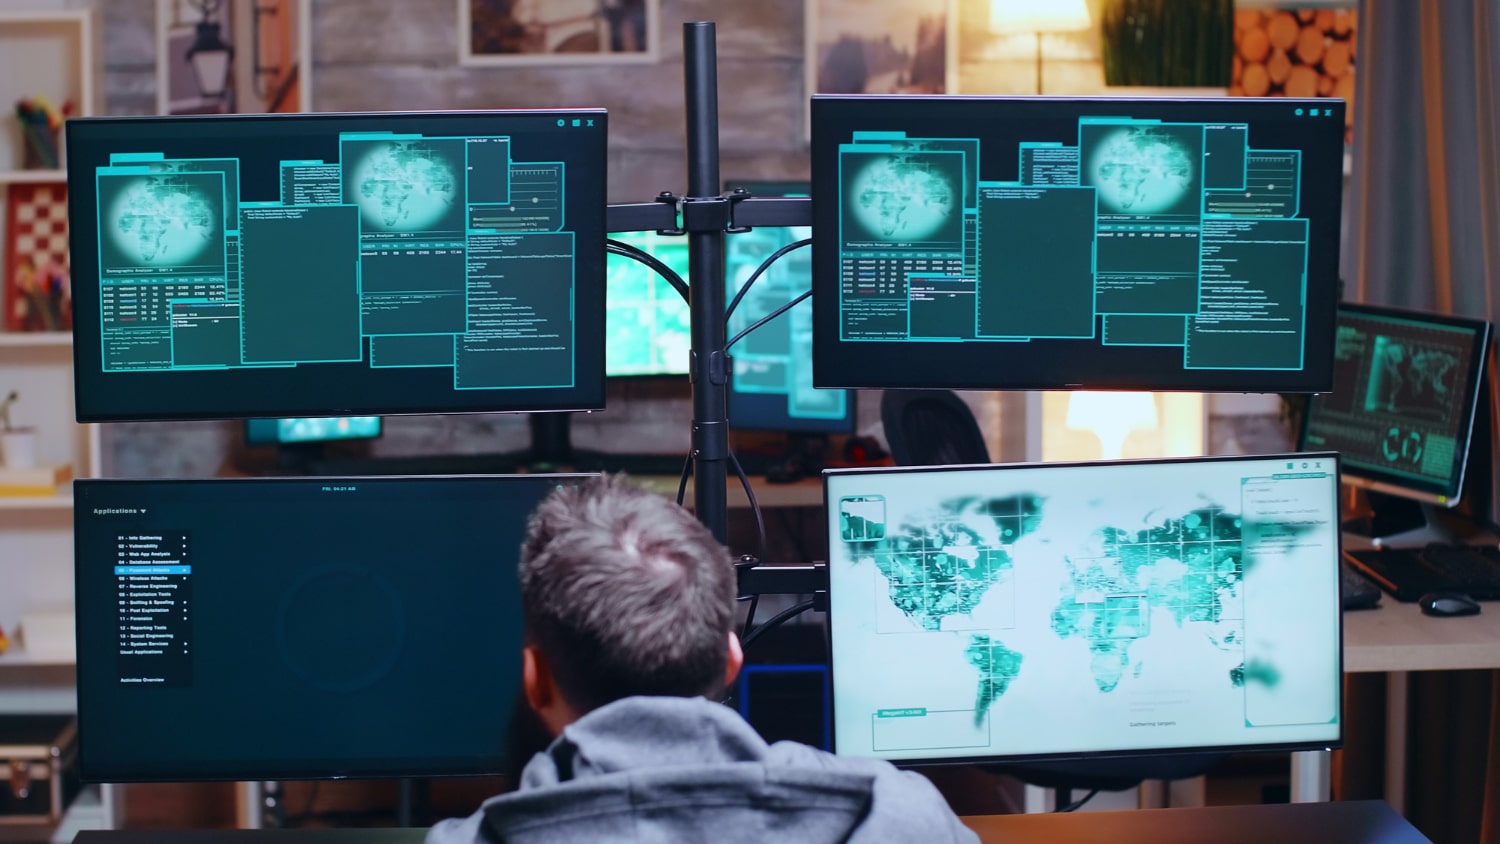
A hypervision platform is only as good as what it puts on screen, and that’s where the control room comes in. The video wall carries the shared overview: key indicators, critical alerts, a map of every site, while each workstation keeps its own detailed views close at hand, often switched through a KVM matrix. It’s the one place where the big picture stays in front of the whole team, all the time.
A handful of principles separate a project that earns its keep from one more piece of software nobody asked for.
One honest caveat worth naming outright: hypervision doesn’t invent data. Feed it a false or incomplete signal from any one source, and correlation just spreads that mistake further and faster. The quality of the underlying monitoring tools and the accuracy of the dependency model are still non-negotiable. The platform amplifies whatever it’s handed, good or bad.
Monitoring watches a defined scope and flags its own anomalies. Hypervision pulls several different monitoring systems together into one correlated, decision-ready view of the whole operation.
No. The hypervision layer connects to whatever monitoring tools are already in place through connectors and aggregates their events. Nothing existing gets thrown out; the big-picture view just gets added on top.
No. It applies just as well to industrial processes, energy, logistics, ports, and site security. Its value only grows with the number and variety of systems that need coordinating.
Start with an audit of the infrastructure and the goals behind it. That sets the scope, decides which sources get integrated, and shapes the correlation rules. An integrator like Motilde, handling both the software side and the control room layout, helps keep the whole thing on track.

Copyright © 2026. MOTILDE. All rights reserved.